
UK Premium Property Market Update July 2026
July gave us two stories running at once, and they are worth separating before we get into the numbers.
The first is a market story, and it has been building for years.

There is more premium property for sale in Britain than at any point in recent years, and a smaller share of it is finding a committed buyer.
The second is a political story, as halfway through the month the country changed Prime Minister, changed Chancellor, and started counting down to a Budget on 28th October that nobody can yet describe with any confidence.
What follows sets out what actually happened in July and across the first seven months of the year, what the wider market data says about pricing and about who is still transacting, and what the policy picture looks like as things stand. I have kept what is confirmed separate from what is speculation throughout, because at this price point the difference matters and a lot of the coverage this summer has not bothered to make it.
A word on what this is not. It is not a case for optimism or for gloom. The data supports neither position cleanly, and anyone selling you one of those two stories is selling you something. It is a description of the market as it is, and a view on what that means if you are about to buy or sell a home in the premium property market.
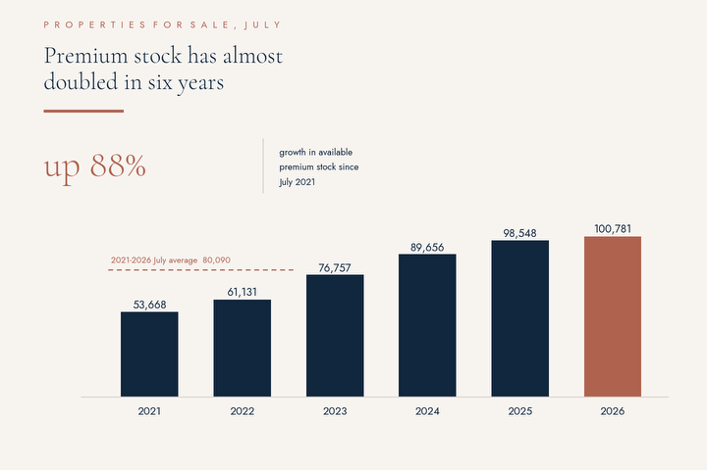
In July 2021 there were 53,668 premium homes available to buy across the UK. This July there were 100,781. Supply at the top of the market has almost doubled in six years. Sales agreed over the same period have risen by less than 8%.
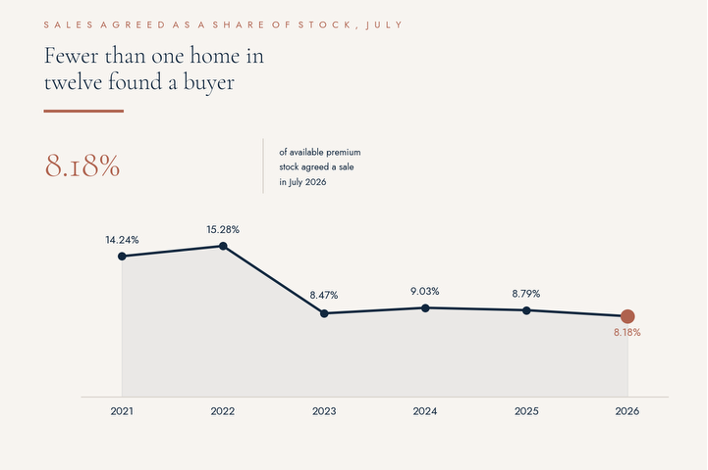
That single comparison explains most of what follows. The premium market is not short of homes and it is not short of sellers willing to test it. What it lacks is the volume of committed buyers needed to absorb what is now standing in front of them. In July, sales agreed accounted for 8.18% of available stock. In July 2021 the figure was 14.24%, and in July 2022 it reached 15.28%. This July was the least efficient since 2021.
For anyone buying or selling in the premium market right now, that ratio matters far more than any headline about average prices. It sets the odds.
Stock has plateaued rather than stopped climbing
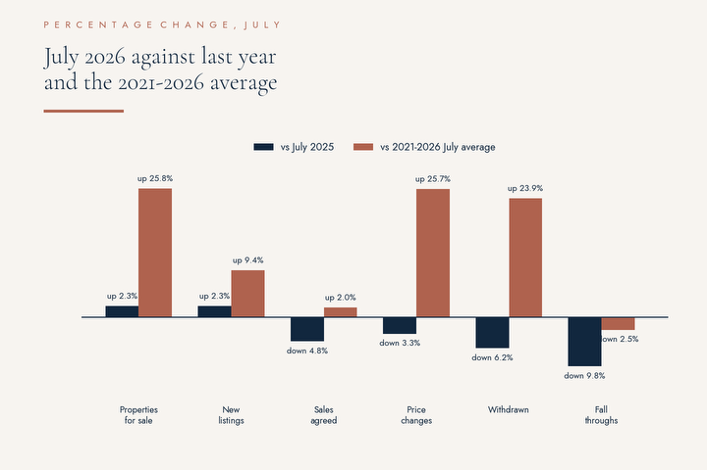
Available stock has risen every July since 2021. From 53,668 to 61,131, then 76,757, 89,656, 98,548 and now 100,781. Six consecutive years of growth, and a figure sitting 25.8% above the 2021-2026 July average.
What is new is the shape of the last two months. June closed at 100,838 and July at 100,781. A difference of 57 properties, which in a market of this size is no movement at all. Two consecutive months above 100,000 is a first for the premium sector, and the plateau is worth reading carefully. Supply has not peaked. Homes are simply arriving and leaving at roughly the same rate now, with the leaving split between sales agreed and sellers giving up.
For a buyer, this is the most choice the premium market has offered in years. For a seller, it is the most competition.
Supply keeps arriving, and July set a record for the month
There were 15,612 new premium instructions in July, up 2.3% on last year and 9.4% above the 2021-2026 July average. No July in recent years has been stronger, with 2025 on 15,265 and 2024 on 15,147 the nearest comparisons.
New listings did fall 13.6% against June, which recorded 18,076. A step down once the school holidays begin says very little about appetite. The more instructive comparison is the run of Julys. New instruction volumes at the top of the market have climbed every year since 2021, from 11,311 to 15,612, and they show no sign of thinning. Sellers are still coming forward in numbers, which tells you something about how many households above this price point have a move they want to make.
The question has never been whether premium sellers want to move. The question is what price they are prepared to accept in order to do it.
The price sensitivity is now structural
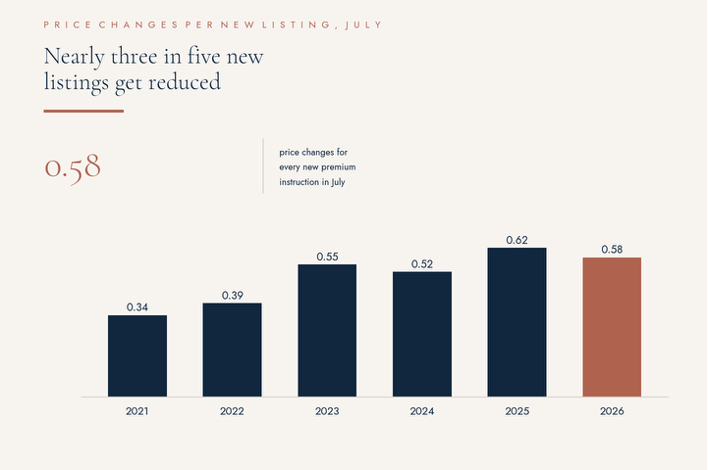
There were 9,122 price changes in July. Down 3.3% on last year and down 12.8% on June, which is the one encouraging line in the July table. It is also 25.7% above the 2021-2026 July average, so the fall needs holding in proportion.
The clearer way to read this is against the volume of stock that could be repriced. Set price changes against new listings and July 2026 delivers 0.58 changes for every fresh instruction. In July 2021 the figure was 0.34. In July 2022 it was 0.39. Something close to three in every five new premium instructions is now attracting a reduction, and the ratio has climbed in every year since 2021 bar one.
Correcting a handful of outliers would be one thing. When the opening asking price is wrong this often, the correction has stopped being an exception and become part of the standard process. Sellers who price to test the ceiling are now the majority, and the majority are being asked to come back down.
More premium sellers are leaving than are agreeing a sale
Of everything in the July table, this is the number I would put in front of a seller first, and it is the one least likely to appear in a portal press release.
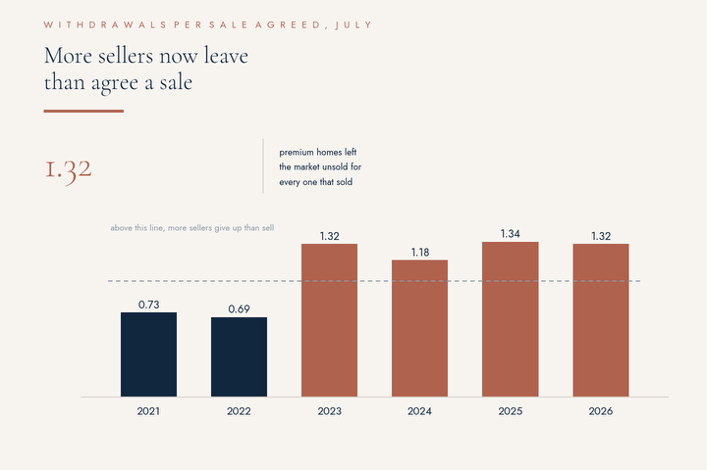
There were 10,858 premium withdrawals in July, against 8,240 sales agreed. For every premium home that found a buyer, 1.32 left the market unsold. In July 2021 the ratio was 0.73, meaning sales comfortably outnumbered withdrawals. It has climbed in every year since.
The July volume itself is down 6.2% on last year, and that is a real improvement. But it is up 13.3% on June and it sits 23.9% above the 2021-2026 July average. The direction of travel over six years matters more than one month of relief. Roughly 60,000 premium homes have been withdrawn so far this year, which is more than the number that have agreed a sale.
Some of those sellers were never fully committed. Some were testing a number. But a large share of them wanted to move, could not achieve the figure they had in mind, and have gone back to waiting. They have not disappeared. They are latent supply, and most of them will return.
Fall throughs are the quiet good news
At 1,939, July fall throughs came in 2.5% below the 2021-2026 July average and 9.8% below last year. They rose 7.5% on June, but the level is unremarkable.
Better still is the rate. Fall throughs equalled 23.5% of July sales agreed, against 24.8% last July, 25.4% in 2024 and 30.1% in 2023. Once a premium sale is agreed in this market it is holding together a little better than it has in recent years. Buyers who commit are proving to be buyers who follow through, which is what you would expect when the people transacting are the ones with the strongest reason and the strongest means to do so.
Year to date, the pattern is the same at greater scale
Seven months of data tell a more reliable story than any single month, and they tell the same one.re
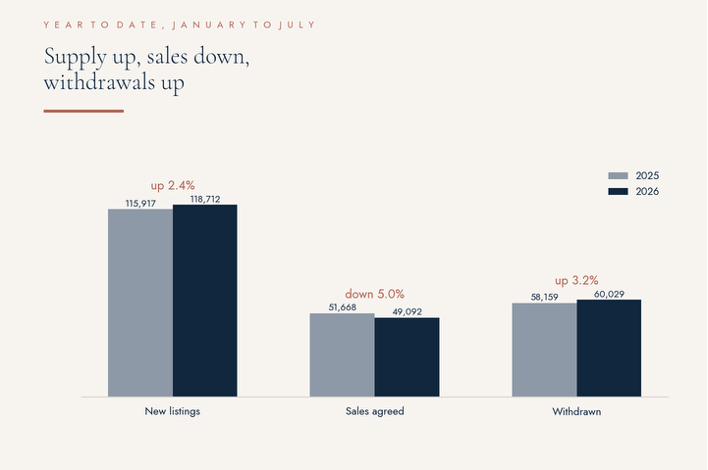
New instructions at 118,712 are the highest since 2021 and 15.6% above average, having risen in every single year since 2021. Average available stock at 91,167 is 26.3% above the 2021-2026 average and has risen every year since 2022, the one exception being a marginal dip that year against 2021.
Against that, sales agreed of 49,092 are down 5.0%on last year and 1.6% below the 2021-2026 average. Withdrawals of 60,029 are up 3.2% on last year and 24.1% above average, and they outnumber sales agreed by close to 11,000 homes. Price changes of 47,541 have eased 1.9% on 2025, but remain 31.5% above the average. Fall throughs of 10,724 are down 10.6% on last year and sit almost exactly on the 2021-2026 average.
Strip the percentages away and the year reads as follows. Supply at record levels, demand marginally softer than last year and slightly below the long run norm, pricing under sustained pressure, and a substantial group of sellers withdrawing rather than accepting what the market will pay.
What is actually happening to prices
Volume data tells you how many homes are changing hands. It says nothing about what they achieve. For that, the Connells Group Housing Brief for summer 2026 is useful.
Their headline finding is that pricing power has softened without prices actually falling. Average prices on sales agreed in the second quarter were still 1.9% higher than a year earlier, and only two regions recorded annual declines: London at 1.9% and the East of England at 0.7% down. That distinction matters enormously at this price point, because London and the South hold the bulk of £750,000 plus stock. The one region where premium homes are most concentrated is the one region where values have gone backwards.
The share of homes selling above their initial asking price has fallen to 17%nationally, down from 20% a year earlier and a long way below the 46% peak of 2022. Above £1 million, sellers were the least likely of any price band to beat their asking price, with the share slipping from 18% to 16%. Connells attribute that partly to affordability and partly to the fact that buyers at this level carry more exposure to wider economic and political uncertainty, and that the property tax measures now being discussed would be felt most acutely here.
There is an important nuance for anyone between £750,000 and £1 million. The £500,000 to £1 million bracket recorded the smallest year on year fall of any band. The pressure at the top of the market is real, but it intensifies as you climb, and the lower reaches of the premium segment are holding up better than the numbers above £1 million suggest.
Regionally the split is stark. In the second quarter, 13% of homes sold in London and the South of England achieved more than their initial asking price, against 21% across the Midlands and North.
Nationwide's index for July gives the national anchor. Annual growth slowed to 1.8% from 2.2% in June, prices were up 0.1% on the month, and the average UK property stood at £277,542. Robert Gardner, their chief economist, described activity and prices as soft against an uncertain backdrop. The conflict between Iran and the United States has pushed up energy prices and market interest rates, leaving expectations for Bank Rate volatile. A market growing at 1.8% a year is not falling, but it is no longer growing fast enough to bail out a seller who has misjudged their price.
Prime London is doing the opposite of everything above
One dataset published this month cuts against the national picture, and it matters because London holds more £750,000 plus stock than anywhere else.
Knight Frank recorded prime London transactions up 14% across the capital in the three months to July, and up 3% in prime central London. Offers made in prime central and prime outer London were running 8% ahead of last year by March, and that has fed through into a busier summer.
Two things need saying before anyone reads that as a recovery. Exchanges were 7% lower over the same three months in both London and prime central London, and against the five year average they are down 6% across London and 15% in prime central London. And prices are still falling. Average prime central London values were down 3.3% in the year to July, the 39th consecutive month of annual decline, leaving them 23% below their peak in mid 2015.
Tom Bill, at Knight Frank, called the high value council tax rates announced in November the thin end of the wedge for a government with limited room to fund its spending plans. His other point matters more. They were not as bad as had been feared. That certainty, however unwelcome, let buyers make plans. Stuart Bailey, who heads their prime central London sales, added that exceptional properties are in such short supply that buyers who would previously never have taken on a refurbishment are now doing exactly that.
Read the two together and prime central London looks like a market that has already been through what the rest of the premium segment is only starting. 11 years of repricing, values down almost a quarter from the peak, and volumes now picking up off a low base because the price finally reflects the position. It is not a happy story for anyone who bought in 2015. For anyone buying now, it is the closest thing to a functioning market at this price point anywhere in the country.
The finding that changes how price reductions should be read
One number from the Connells data deserves to be read twice by anyone thinking of launching high and adjusting later.
Homes that have been reduced are 27% less likely to receive an offer than homes that have not been reduced.
That runs against the instinct behind most reductions. The assumption is that a reduction fixes a pricing problem and restores interest. The evidence suggests instead that most reductions are correcting a starting point that was too high in the first place, and that the correction does not undo the damage. A reduced property carries a history, and buyers read that history as a signal about the seller rather than the house.
Set that against your own market. There were 9,122 premium price changes in July and 47,541 so far this year, running 31.5% above the 2021-2026 average. A very large number of premium sellers are currently engaged in a strategy that, on this evidence, actively reduces their chance of a sale.
Who is actually buying
Connells also found that movers accounted for 53% of all purchases in the first half of 2026, the lowest share on record and down from 63% in 2021. Homeowners are staying put unless something forces the issue, whether that is a growing family, a job move, a separation or a genuine need to downsize.
The premium market is almost entirely a mover market. Very few people buy their first home at £750,000, and investor activity at this level is limited by yield. So when the mover share hits a record low, the premium segment absorbs that hit more directly than any other part of the market.
This is the missing piece behind 60,029 withdrawals. The explanation is not simply that sellers are refusing lower offers. The buyer for a £900,000 family house is usually someone who must sell their own £600,000 house first, and that person is increasingly choosing not to start.
Connells also reported that 47% of applicants registering to buy in the second quarter were looking for three bedrooms or more, the highest share in five years. The appetite for space is still there. It has just become far more conditional.
The pool of people who can buy at this level is getting smaller
Almost everyone buying above £750,000 is drawing on substantial wealth, whether that sits in a business, a portfolio, a pension or the equity in their existing home. So the size of that population is a demand indicator for the premium market in a way it is not for the market as a whole.
The Adam Smith Institute's Millionaire Tracker, published at the end of July, puts the number of sterling millionaires resident in Britain at 442,000, a fall of 7% since 2024 and the lowest figure since the global financial crisis. The measure counts adult UK residents with individual net wealth of at least £1 million across property, pensions and financial assets, held at constant 2025 prices.
Three caveats before anyone reaches for a conclusion. This is a modelled estimate built from Office for National Statistics data rather than a count of actual people. A fall of 7% does not mean 7% of millionaires have left the country, because inflation alone will have pushed some households below the threshold without anyone moving anywhere. And the Institute is a free market think tank whose recommendations include abolishing inheritance tax and phasing out capital gains tax, so the framing carries a policy agenda.
The reason it still matters is what the Institute identifies as the causes. Weaker values in London's high end housing market, subdued household saving, the abolition of the previous non-domiciled tax regime, and speculation about further changes to wealth, inheritance and capital gains taxation. There is a loop in there worth naming rather than glossing over. Falling prime London values are being counted as a cause of shrinking measured wealth, and shrinking wealth is then offered as an explanation for falling prime London values. Both are happening. Neither cleanly causes the other.
What survives the caveats is straightforward enough. The cause could be departures, weaker asset values or simply inflation eroding what people hold. Either way, the population able to transact comfortably above £750,000 is smaller in real terms than it was two years ago. The number of homes competing for that population has risen to 100,781. That is the absorption rate falling from 14.24% to 8.18%, described from the other side.
People are staying put for far longer, and premium owners longest of all
Everything above describes a market where sellers outnumber committed buyers. The deeper question is why so few households are starting a move at all, and the answer published this month is the most useful piece of context in this update.
Connells analysed Land Registry data across England and Wales and found that the share of sellers who had owned their home for less than three years has fallen to 5%, the lowest on record. It was 8% in 2016 and 15% in 2006. The share selling within five years has fallen from 29% in 2006 to 14% now, and the share selling within ten years from 47% to 32%. The average seller this year had owned their property for 12.3 years, against 9.2 years a decade ago.
Aneisha Beveridge, their research director, put it plainly: moving no longer pays. High stamp duty, higher mortgage rates and weak price growth have combined to keep households where they are, and when they do move it has to be a bigger and longer term decision rather than an incremental step. Their estimate is that if people still moved as often as they did in 2006, the market would see around 439,000 additional transactions every year.
Nationwide's July index adds the tenure dimension. The average length of residence across all tenures is around 14 years. For those who own their home outright it is close to 24 years, with roughly a third of outright owners having been in the same property for 30 years or more. Owners with a mortgage average 8.9 years. This is tenure data rather than price band data, so it does not measure the premium market directly. Outright ownership is far more common at the top, though, so the direction of the inference is not in much doubt.
The number that explains the withdrawals
One figure in the Connells analysis belongs at the centre of any conversation about the premium market right now.
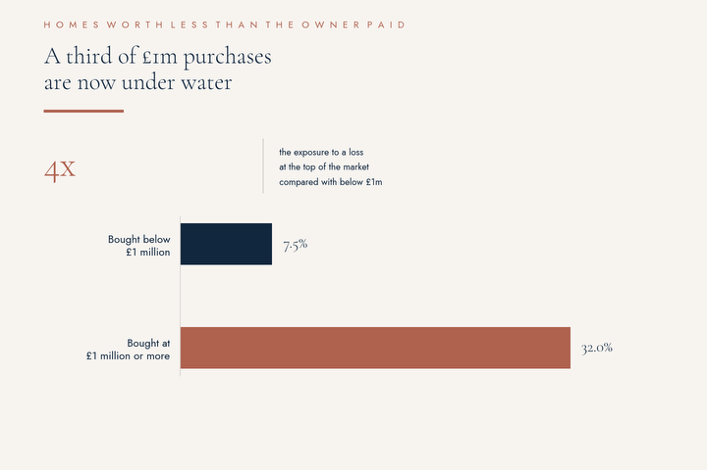
Around 32%of homes originally bought for £1 million or more are estimated to be worth less than their owner paid for them. For homes bought below £1 million, the figure is 7.5%.
More than four times the exposure. In London, where premium stock concentrates, 21% of all homes are estimated to be worth less than their owners paid, against 7.9% nationally. London has also seen the sharpest change in moving behaviour anywhere in the country: just 9% of sellers in the capital this year had bought within the previous five years, down from 27% in 2006 and the lowest share of any region.
The wider loss data tells the same story. Among sellers who had owned for five years or less, 20% sold for less than they paid this year, against 6% in 2006. Among those selling within three years it was 23%, up from 10% two decades ago.
This is the motive that the volume data cannot show you. Picture an owner who bought in 2021 and now learns the market values their home below what they paid. They are not weighing a lower offer against a higher one. They are weighing a real loss against staying put, and staying put costs nothing today. That is why 60,029 premium homes have been withdrawn this year without selling, and it is why so many of those sellers will come back rather than disappear.
For buyers, the same figure is the single most useful thing to know before making an offer. A seller who paid more than their home is worth today will resist a reduction far harder than one sitting on 12 years of gains, and knowing which of the two you are dealing with is worth more than any negotiating technique. The purchase price is a matter of public record.
July was also the month the government changed
Every figure in the tables above was recorded while Downing Street changed hands.
Keir Starmer resigned as Labour leader on 22nd June, after more than 90 Labour MPs had called on him to set out a departure timetable. Andy Burnham, who had left Westminster nearly a decade earlier to become mayor of Greater Manchester, returned to Parliament through the Makerfield by election, won the leadership unopposed and was formally appointed Prime Minister by the King on 20th July. He is the seventh Prime Minister in ten years. There was no general election and the next is not expected for around three years.
The appointment of John Healey as Chancellor came as a surprise. He had served as Defence Secretary under Starmer and resigned in June over what he saw as inadequate defence spending. He now holds the Treasury with a Budget to deliver inside four months of taking office.
So the premium market spent the second half of July with a new Prime Minister, a new Chancellor and no published fiscal plan. At a price point where buyers are frequently funding purchases from investments, business proceeds or the sale of another asset, that is precisely the kind of uncertainty that postpones a decision by a few weeks.
The data is more measured than that reasoning might suggest. Sales agreed still rose slightly on June, so nothing collapsed. The number that fits the mood is withdrawals, up 13.3% on June. Sellers who were already unconvinced by the price on offer found one more reason to step back.
The Budget on 28th October is now the fixed point in the calendar
Healey announced on 31st July that his first Budget will be delivered on Wednesday 28th October. He has framed it as an event built on fiscal discipline that will move money and power out of Westminster and into every postcode in Britain, and he has retained the previous government's fiscal rules on borrowing.
That combination creates a straightforward arithmetic problem. Income tax, national insurance and VAT have all been ruled out, and those three raise the bulk of the Treasury's revenue. Anything new therefore has to come from somewhere else, and Capital Economics has suggested the total could approach the £26bn raised by Rachel Reeves last year, weighted towards capital, wealth and income.
For anyone buying or selling in the premium market, the useful discipline is separating what is settled from what is speculation.
Already confirmed and legislatedsure
Detail
High Value Council Tax Surcharge
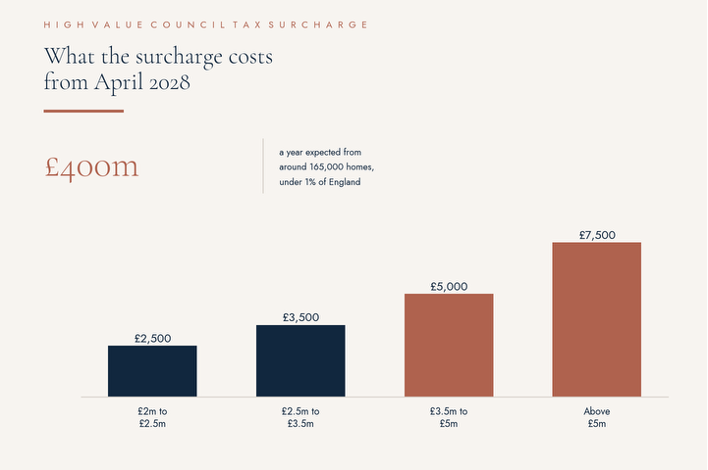
Annual charge from April 2028 on English homes valued at £2 million or more, based on 2026 values. £2,500 between £2 million and £2.5 million, £3,500 to £3.5 million, £5,000 to £5 million and £7,500 above £5 million. Owners are liable rather than occupiers. Revaluation every five years and CPI uprating from 2029 to 2030
Stamp duty
Unchanged in this Budget. Burnham has ruled out scrapping or altering it and has rejected reports that stamp duty and council tax would be merged into a single annual property tax. The 5 per cent surcharge on additional properties and the 2 per cent surcharge for buyers based overseas both stand.
Capital gains tax on residential property
18 per cent and 24 per cent for 2026 to 2027, with a £3,000 annual exempt amount
Property income tax
Rates rise from April 2027, which matters to anyone holding rental property alongside a main home
Still speculation
A reduction in the £2 million surcharge threshold to £1.5 million, which would bring a far larger number of homes into charge. Alignment of capital gains tax rates with income tax rates, which is the reform favoured by the more moderate wing of the party. And a broader wealth tax of around 2.0% on assets above £10 million, which has been described as off the agenda for now, but which the Prime Minister has repeatedly declined to rule out.
None of the three is policy. The reason they matter anyway is that markets at this level trade on expectation, and the ten weeks between now and 28th October will be filled with speculation regardless of what is eventually announced.
Why the tax already in place matters more than the tax being discussed
Property has never been taxed more heavily in Britain, and the burden falls disproportionately on the segment this update covers.
Connells set out the scale of it. Stamp duty raised around £740 million across England in 1997, worth roughly £1.4bn at 2026 prices. England now collects around £10.3bn, and the Royal Borough of Kensington and Chelsea together with the City of Westminster account for £1.3bn of that on their own. Roughly half of all stamp duty revenue now comes from buyers paying one of the surcharges, and a buyer based overseas purchasing an additional property above £1.5 million faces a rate of up to 19%.
Connells argue that these transaction costs are one of the main reasons prime central London values sit lower today than they did a decade ago. That is a significant claim and it is worth holding alongside the political conversation about asking more from higher value homeowners, because a good deal of the wealth those policies assume has not actually materialised at the top of the market.
Their analysis of the alternative is equally instructive. A land value tax raising comparable revenue would charge households somewhere between 0.4%and 1% of their home's value every year. Modest homeowners across the South of England could face annual bills of £5,000 to £10,000. That is a recurring drain on income rather than a single cost at the point of moving, and it falls hardest on households rich in property and short of cash. For many mid market homes the annual increase would exceed the mansion tax bills levied on far more expensive properties.
Stamp duty is a flawed tax. Stamp duty suppresses mobility and it is the reason a meaningful number of premium households simply stay where they are. But the honest reading of the alternatives is that they move the burden rather than remove it, and they move it towards people who are not moving at all. That is worth remembering over the next ten weeks, when the case for reform will be made far more loudly than the case for who pays instead.
The £2 million line is already changing how people behave
There is hard evidence of what a threshold does to a market, and it comes from the surcharge that has already been legislated.
Hamptons found that in February 2026, 83% of offers on homes priced within 10.0% of £2 million came in below the £2 million mark, compared with 64% a year earlier. Buyers are actively structuring offers to stay under the line, and sellers are accepting them.
Concentration matters here. According to the House of Commons Library, fewer than 1.0% of all English property sales between January 2024 and April 2026 were at £2 million or above. London accounted for 67% of them, with the South East a distant second. This is a tax that lands heavily on a narrow band of homes in a small part of the country, and the great majority of the £750,000 plus market sits well below it.
That does not make it irrelevant to the wider premium segment. The consultation on the surcharge closed on 14th July, inside the reporting month, and it included the question of whether an additional premium should apply to owners living overseas. Because liability rests on 2026 values, owners anywhere near the threshold now have a direct financial interest in what their home is deemed to be worth this year. Savills described the measure as probably the least worst outcome for owners of prime property when it was announced, and suggested it would eventually act as an incentive for older owners to downsize.
Threshold behaviour of this kind is one of the mechanisms sitting behind 9,122 price changes in a single month.
There is more detail in the consultation than most coverage has picked up, and several points bear directly on anyone at or near the threshold.
The Valuation Office is carrying out the valuation exercise now, combining automated models with professional judgement, and owners will keep the right to challenge a banding. Liability sits with the legal owner, which includes trustees where a home is held in trust and leaseholders whose lease was originally granted for more than 21 years. Companies could face the surcharge alongside the existing Annual Tax on Enveloped Dwellings. A deferral scheme is proposed for eligible main residence owners who would struggle to pay, with interest on deferred amounts pencilled in somewhere between 3.75% and 4.75%. The government is also looking at an additional premium where the owner is not a UK resident for tax purposes.
Two features deserve more attention than they have had. The charges rise with CPI from 2029 onwards, but the £2 million threshold itself is fixed at 2026 values and is not indexed. Every year of house price growth after that therefore pulls more homes into charge without a single decision being taken.
Campaigners against the surcharge point to the Annual Tax on Enveloped Dwellings, which began at £2 million and was cut to £500,000 within three years. That is a campaign group's argument rather than a government intention, and it should be read as such, but the precedent is real.
The second is bunching. The Office for Budget Responsibility expects a behavioural response, including price adjustment and offers clustering below the band boundaries at £2 million, £2.5 million, £3.5 million and £5 million. The Hamptons evidence above shows that happening already, two years before the first bill lands.
The consultation closed on 14th July and the government has not published its response. The main provisions are expected in a future Finance Bill, so the 28th October Budget is the first realistic opportunity to see the final shape of it.
In fairness to the policy, the case for it is not hard to state, and the government states it bluntly. A band D home in Darlington or Blackpool worth around £400,000 pays £2,400 to £2,600 in council tax a year. A £10 million house in Mayfair in band H pays roughly £2,100. Council tax still rests on 1991 valuations, and no serious observer defends that as fair. The surcharge is expected to raise around £400 million a year from between 145,000 and 165,000 homes, which is fewer than one in a hundred properties in England. Whether an annual charge on unrealised value is the right correction is a separate argument from whether a correction was needed.
Borrowing costs stayed still while everything else moved
The Bank of England held the Bank Rate at 3.75%on 30th July. That is a fifth consecutive hold. The Monetary Policy Committee split six to three, and the three dissenters voted for an increase to 4% rather than a cut. CPI inflation fell more than expected in June, to 2.6%.
Fixed mortgage rates edged up during July as fighting in the Middle East resumed, though some lenders have cut selected rates through August. The next rate decision falls on 17th September and forecasts for where the year ends range from 3.5% to 4.25%, which tells you how little consensus there is.
The rate actually being paid tells the story better than the rate being set. Connells report that mortgage rates taken out by home buyers peaked at 5.17% in mid April, taking them back to levels last seen in late 2023, before easing to around 4.87%. Confidence at the top of the market tracks that number closely, and the recovery in it has been slow.
The consequence shows in their forecast. Connells now expect higher rates and wider uncertainty to cut completions across Great Britain by around 100,000 this year, against an earlier forecast of 1.15 million. Sales agreed across their network in the second quarter were 4.2% below a year earlier, which is worth setting against your own segment. Premium sales agreed are down 5.0% year to date and 4.8% in July. The premium market is not underperforming the wider market. It is tracking it closely, with more stock and more visible price adjustment on top.
Two things follow for the premium market. Affordability did not improve in July, so nobody was handed a reason to bid more. It did not deteriorate either, and the wider picture is one of resilience rather than retreat. Net mortgage borrowing across the whole market rebounded to £7.7bn in June from £3.3bn in May, approvals rose to 58,200, and second quarter growth of 0.4% was the fastest in the G7.
So the constraint at the top of the market sits in the asking price rather than the mortgage market.
What this means if you are selling a premium property
Your competition is the largest it has been in several years, and roughly a third more of your peers will leave the market unsold this year than will agree a sale. The properties finding buyers are not doing so because the market has improved. They are doing so because they were priced where a buyer would actually commit.
The 0.58 price changes per new instruction figure is the one to sit with, alongside the finding that reduced homes are 27% less likely to attract an offer than homes that were never reduced. If you launch at a number designed to leave room for negotiation, you are joining the majority who reduce, and the reduction is unlikely to buy back the interest you lost. A property that has been on the market for four months with two reductions behind it is negotiating from a weaker position than one launched correctly and dealt with in six weeks. Ambition is not being rewarded this year. Accuracy is.
There is also a calendar question that did not exist three months ago. If you launch in early September you have roughly seven weeks before the Budget, which is enough time to agree a sale but rarely enough to exchange. If you wait until November you will be entering the market in its quietest weeks, though with the tax position finally known. Neither route is obviously right, and it depends heavily on whether your sale carries any capital gains exposure. What is clear is that hoping the market improves while you wait is not a strategy the data supports. Stock is at record levels and there is no sign of that easing.
One harder thought for anyone who bought above £1 million in the last five years. If your home is currently worth less than you paid, you are in the position roughly a third of buyers at that level now share, and no amount of patience in the asking price changes that arithmetic. The choice is between accepting today's value and moving on with your life, or staying where you are until the market catches up, which on 1.8% annual growth will take years rather than months. Both are legitimate. Listing at yesterday's price and waiting is the one option that costs you money in fees, disruption and a visible price history without changing the outcome.
What this means if you are buying a premium property
You have more to choose from than at any point in previous years, and the seller across the table from you is statistically more likely to withdraw than to sell. That is leverage, and it rewards patience rather than aggression.
Look closely at listing history. A home that has been available for months with reductions behind it is a different negotiation from a fresh instruction priced sensibly, and the second is often the better buy even at a firmer number. Also watch the withdrawn stock. 60,000 homes have come off the market this year without selling, and a proportion of those owners still want to move. Approached directly, some of them are more realistic in private than their old asking price suggested.
The one caution is on the sale itself. Fall through rates have improved, but roughly one in five agreed premium sales still collapses. Being organised, funded and quick remains the most valuable thing you bring to a negotiation, and in a market this well supplied it is often worth more to a seller than an extra few thousand pounds.
Where this leaves us
Years of writing these updates has taught me to be wary of neat conclusions, but July has an unusually clear shape to it.
Supply is at a record and has stopped climbing, which is the first genuinely new thing to happen to this market in several years. Demand is concentrating rather than collapsing, and it is concentrating among older, wealthier, equity rich households who are less troubled by mortgage rates than by whether the move is worth making at all. Prices nationally are drifting up at 1.8% a year and falling in the one region that holds the most premium stock. And underneath all of it sits a group of somewhere near 60,000 sellers who wanted to move this year, could not get their number, and have gone back to waiting.
The reason they are waiting is now measurable, and it is the finding I will carry into the rest of the year. Around a third of homes bought above £1 million are worth less than their owner paid. Those owners do not need persuading to be patient. A great many of them cannot move without accepting a loss, so they stay where they are, and the homes pile up behind them.
Two consequences follow, and neither of them changes on 28th October.
If you are selling, the price you launch at is the whole decision. Everything else is detail. A property priced where a buyer will actually commit sells in this market, and roughly three in five that are not get reduced, after which the odds get materially worse. The Budget will not fix a launch price and neither will a longer wait.
If you are buying, this is the strongest position buyers have held at this price point in at least half a dozen years, and the leverage is in the homework rather than the haggling. Purchase prices are public. Listing histories are public. Knowing whether the person across the table is sitting on twelve years of gains or a loss they cannot face is worth more than any amount of nerve.
As for the Budget, I would not plan around it. Stamp duty reform has been ruled out for this one. The mansion tax is already legislated and its threshold is fixed at 2026 values whether prices rise or not. Capital gains and a broader wealth tax remain speculation, and speculation is what the next ten weeks will be full of. The households I see transacting successfully are the ones making decisions on their own circumstances rather than on a Chancellor's timetable.
The premium market is slow, fussy and unforgiving of a wrong price. All three are different problems from a market in trouble, and the difference is worth holding onto.
Get in touch with us
First Name*
Last Name*
Mobile Phone*
Your Email Address*
Are you looking to*
Please enter message here*
Please confirm that it is okay for us to contact you about this information as well as products and services. (You will always be given the right to unsubscribe at any point in the future)*